Urban Fieldworks
Urban Fieldworks is an exercise that investigates the ordinary happenings and encounters found within an urban landscape.
Eyes In The Sky
"Eyes in the sky” is an analysis of the intensity of surveillance in our surroundings by focusing our data research on the average amount of CCTVs in 3 MRT lines that cross different parts of Singapore.
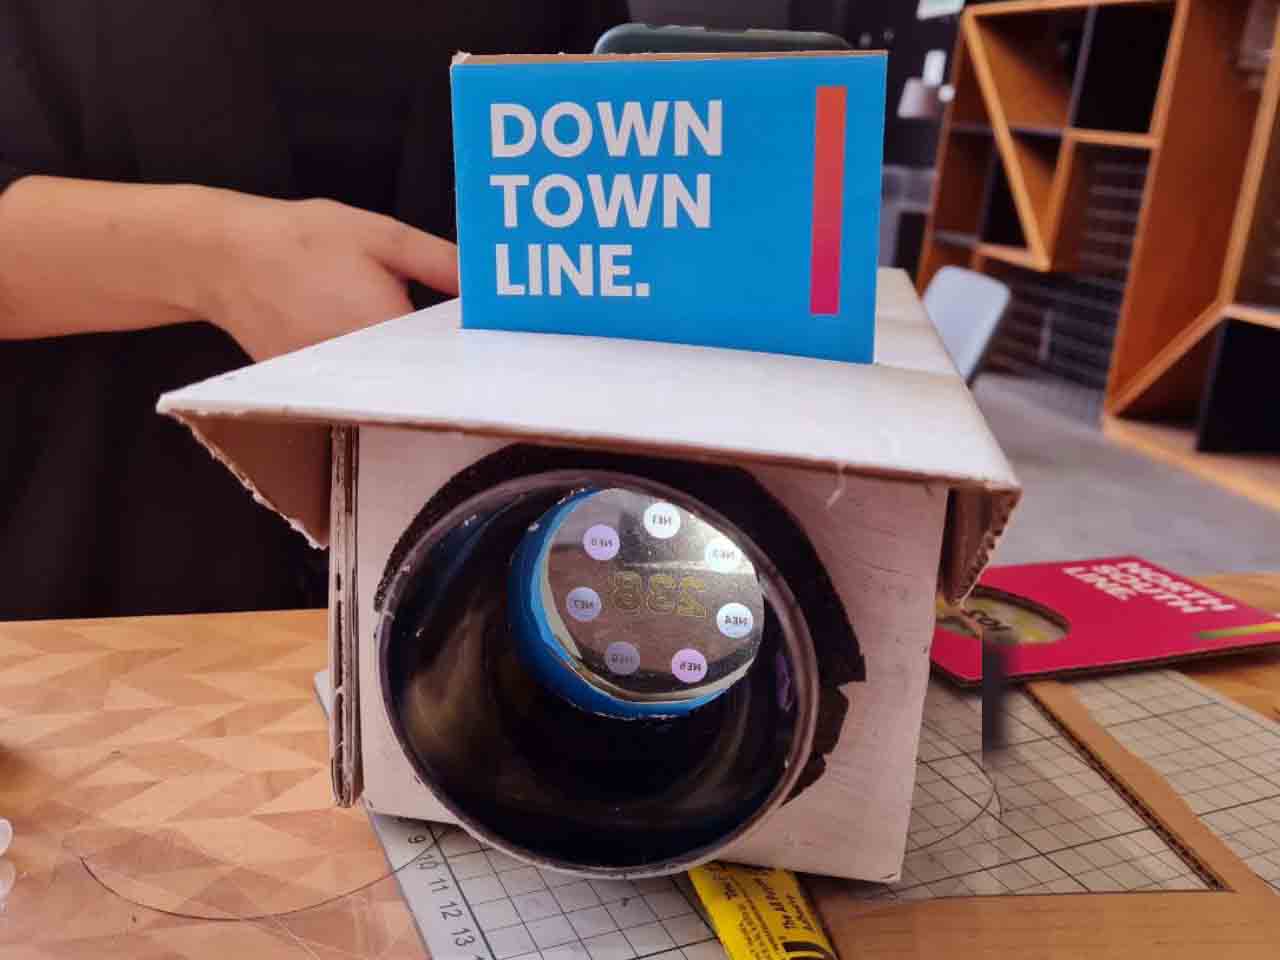
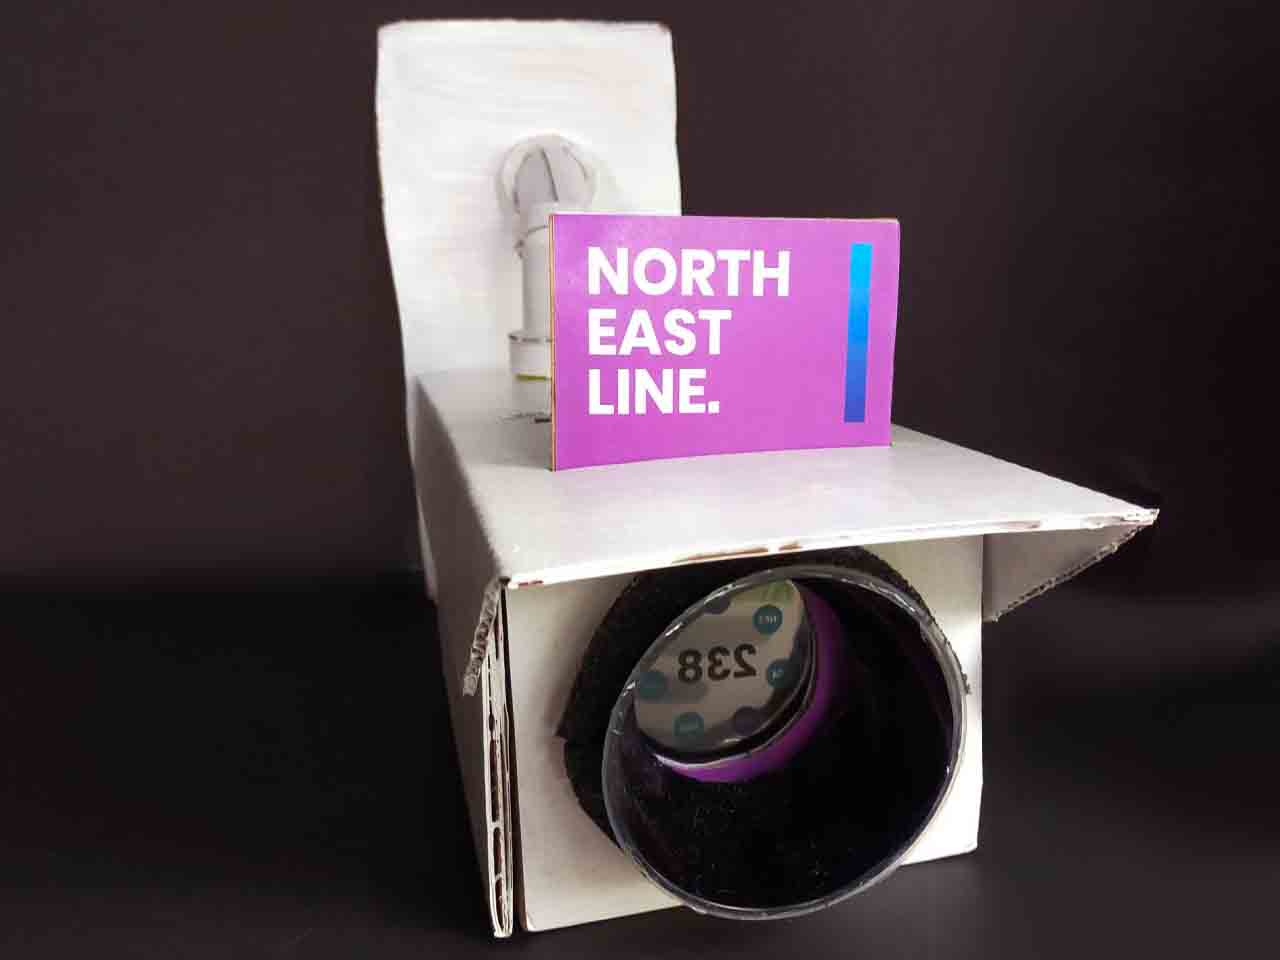
We present our data in the form of an infographic and a projector in the shape of a CCTV. We utilize color intensity to represent the intensity of CCTVs at each station we visit, and we place the average amount of each MRT line in the center for comparison. For the projector, we presented each MRT line with a different projector slide for interactivity.
Field Trip
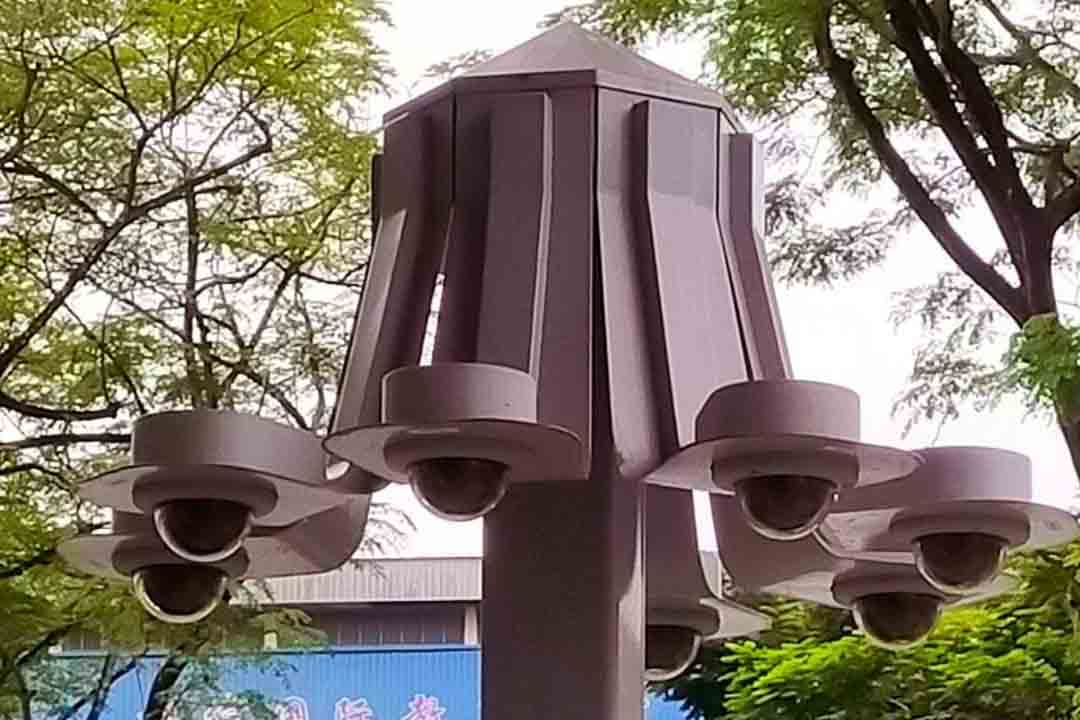
We began our investigation by embarking on a field on these MRT line stations:
Downtown Line: Beauty World, King Albert Park, 6 Avenue, Tan Kah Kee, Botanic Gardens, Stevens and Newton
North South Line: Novena, Toa Payoh, Braddel, Bishan, Ang Mo Kio, Yio Chu Kang and Khatib
North East Line: Harbour Front, Outran, Chinatown, Clarke Quay, Dhoby Ghaut, Chinatown, Little India, Farrer Park
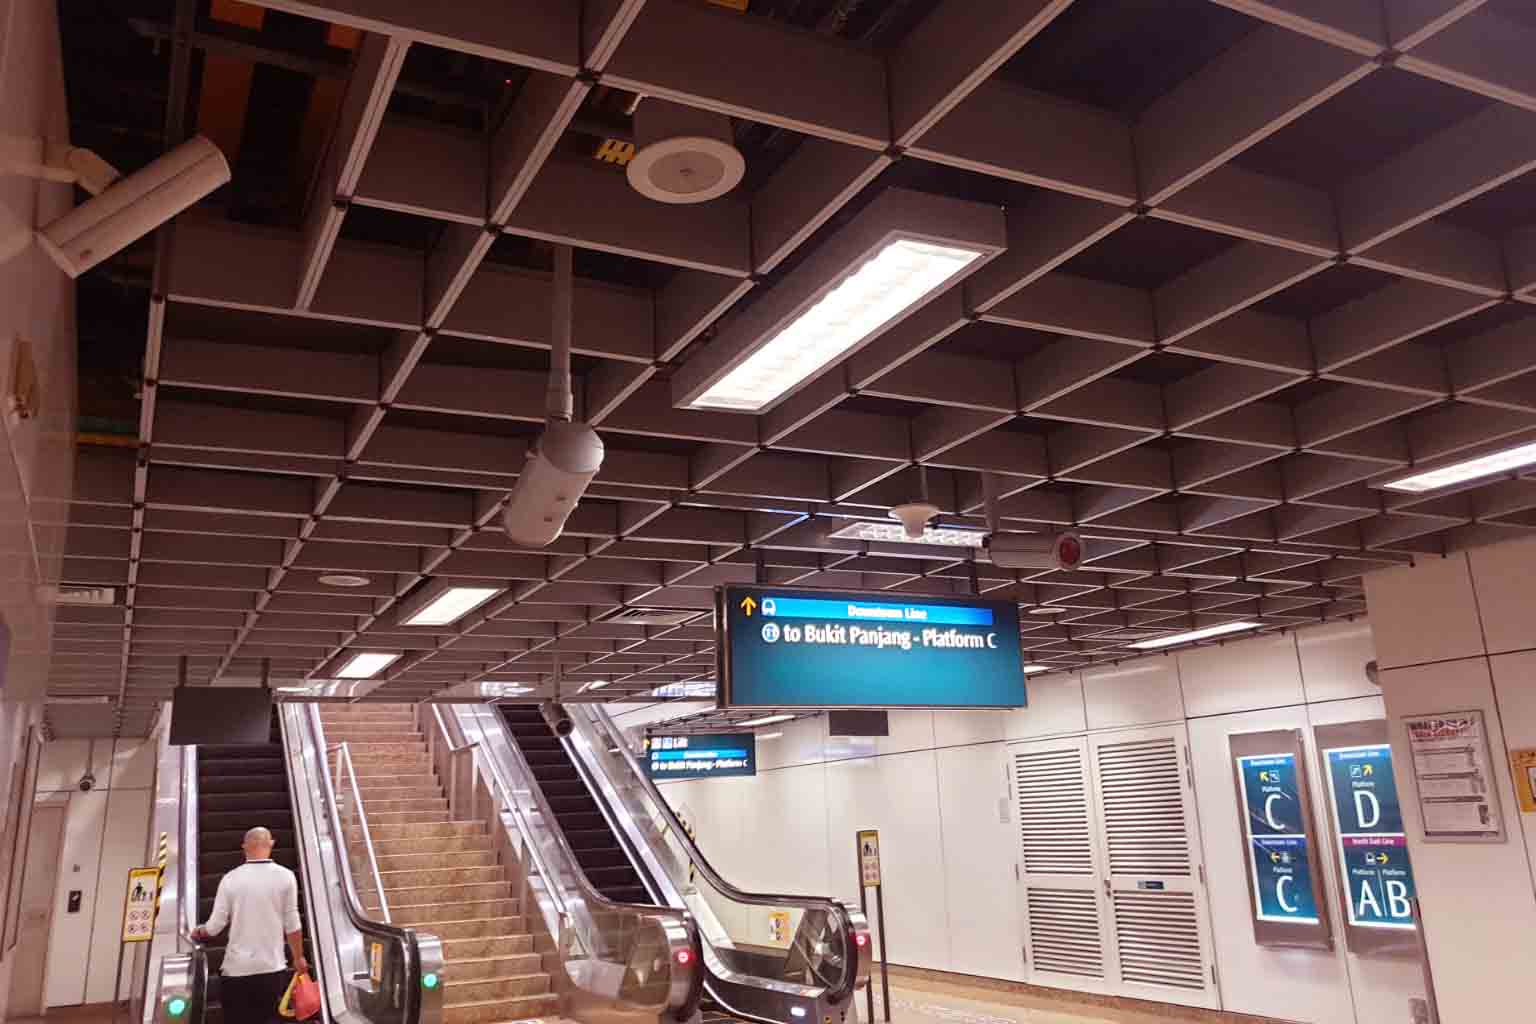
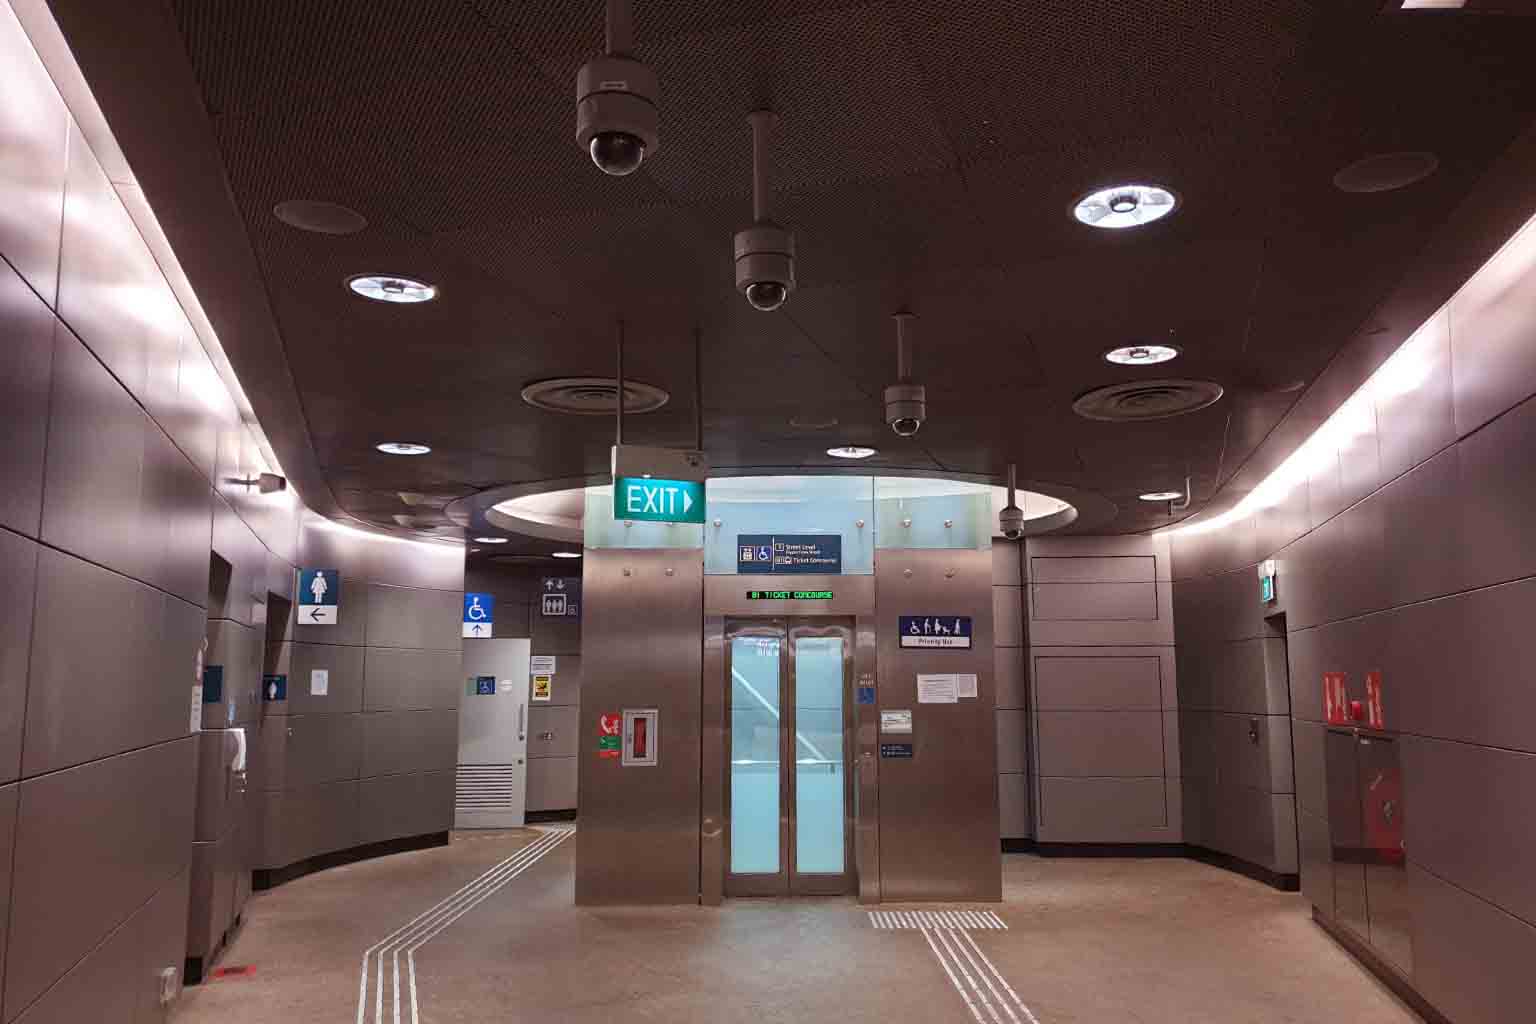
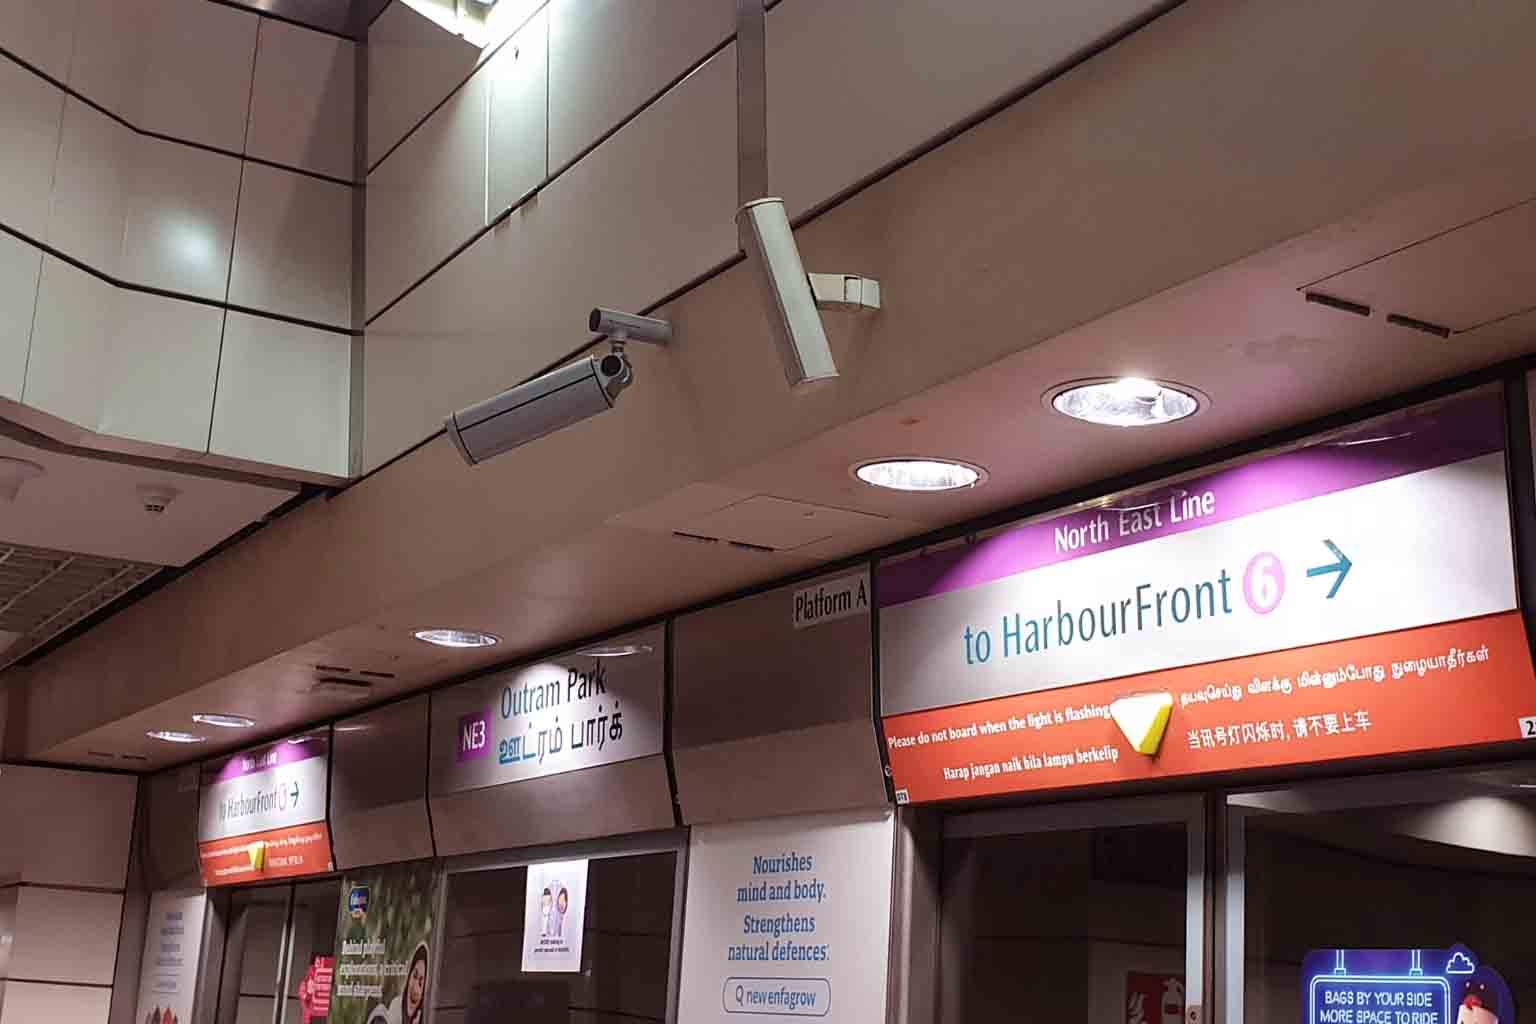
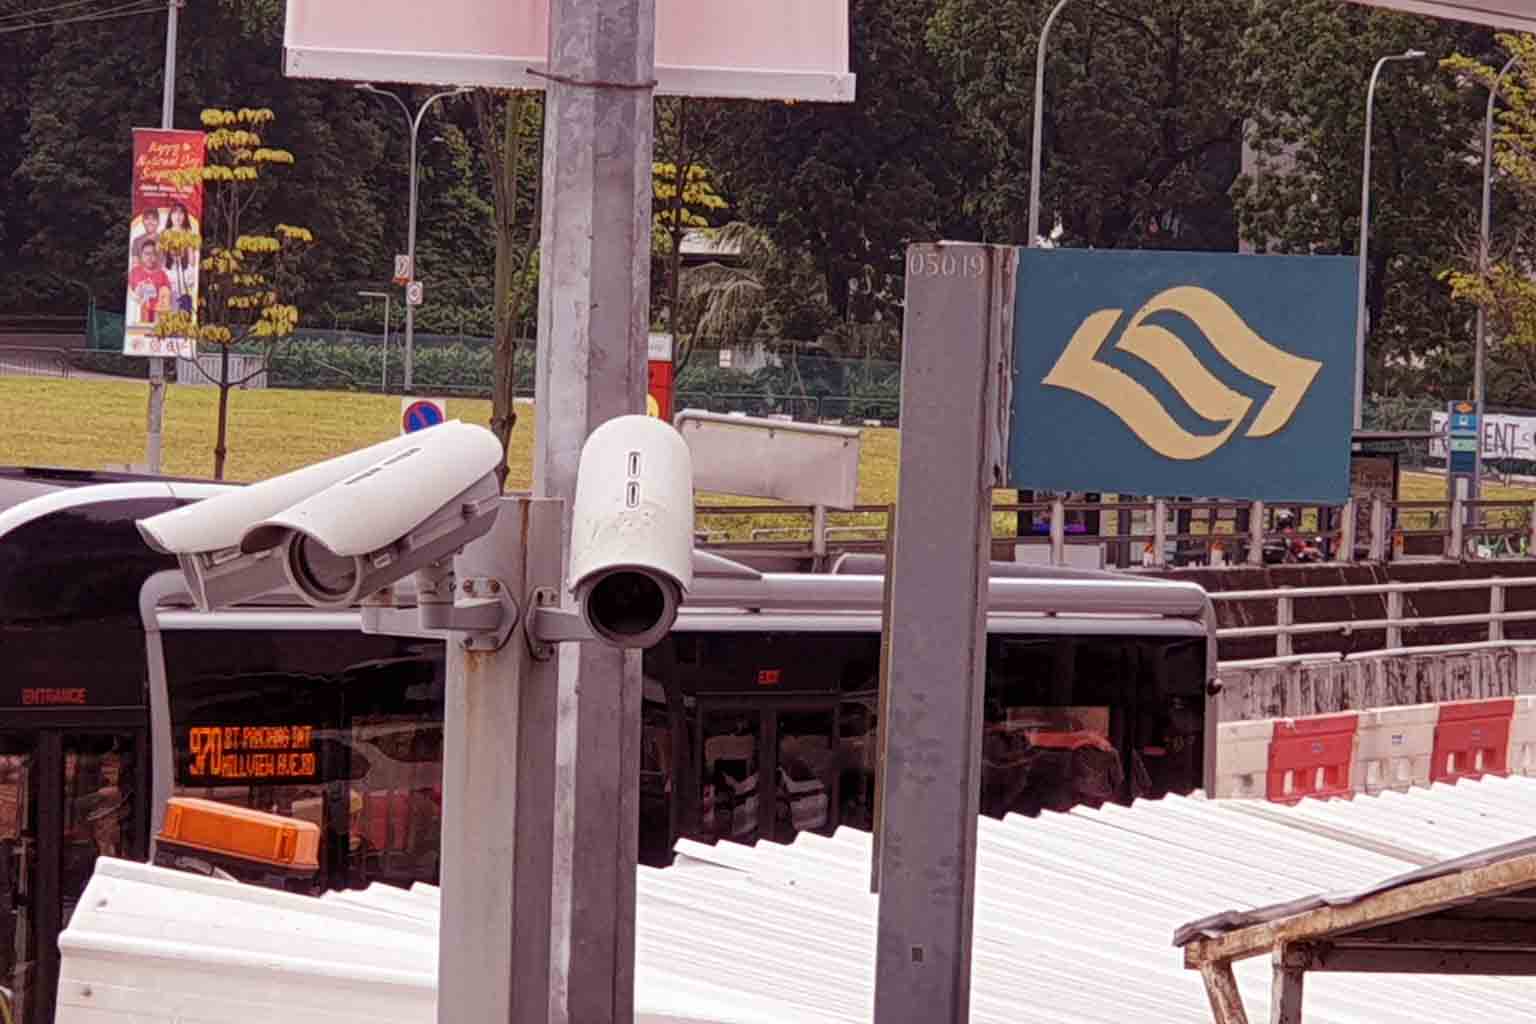
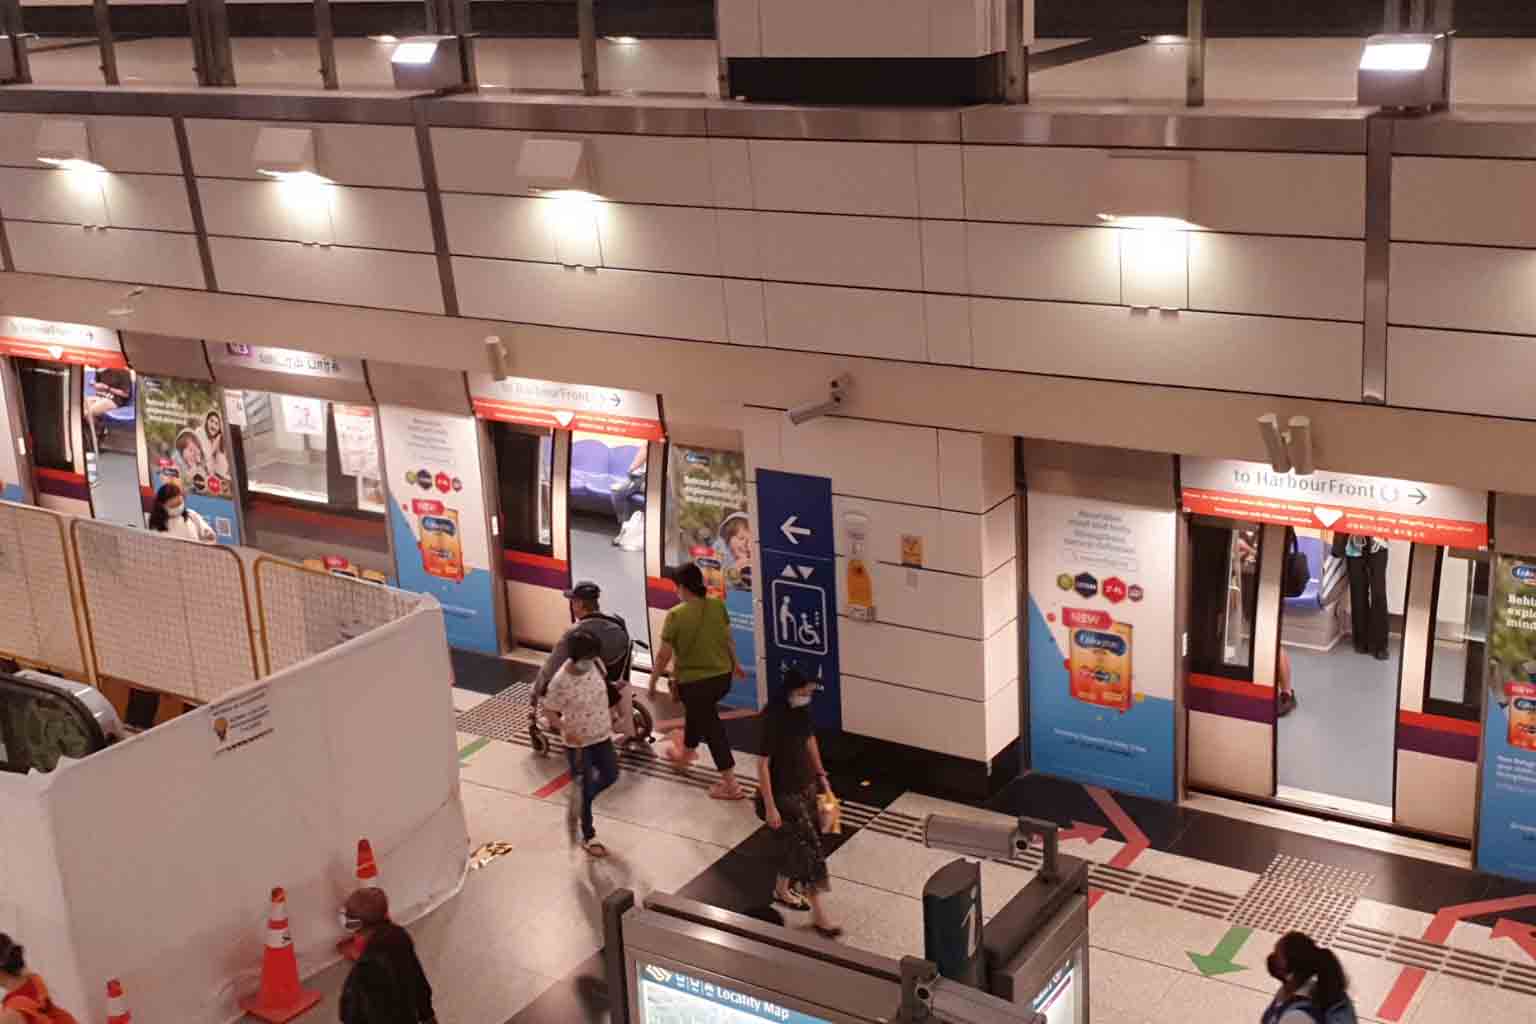
We recorded our findings with pen and paper as we counted every CCTV that we spotted in the vicinity. We faced some challenges along the way such as trying to spot cameras that were camouflaged into the ceiling or environment as well as trying our best to not look suspicious in the MRT. This is also the reason why we felt discouraged to take photos of the CCTVs.
Our Field Trip Gallery

Data
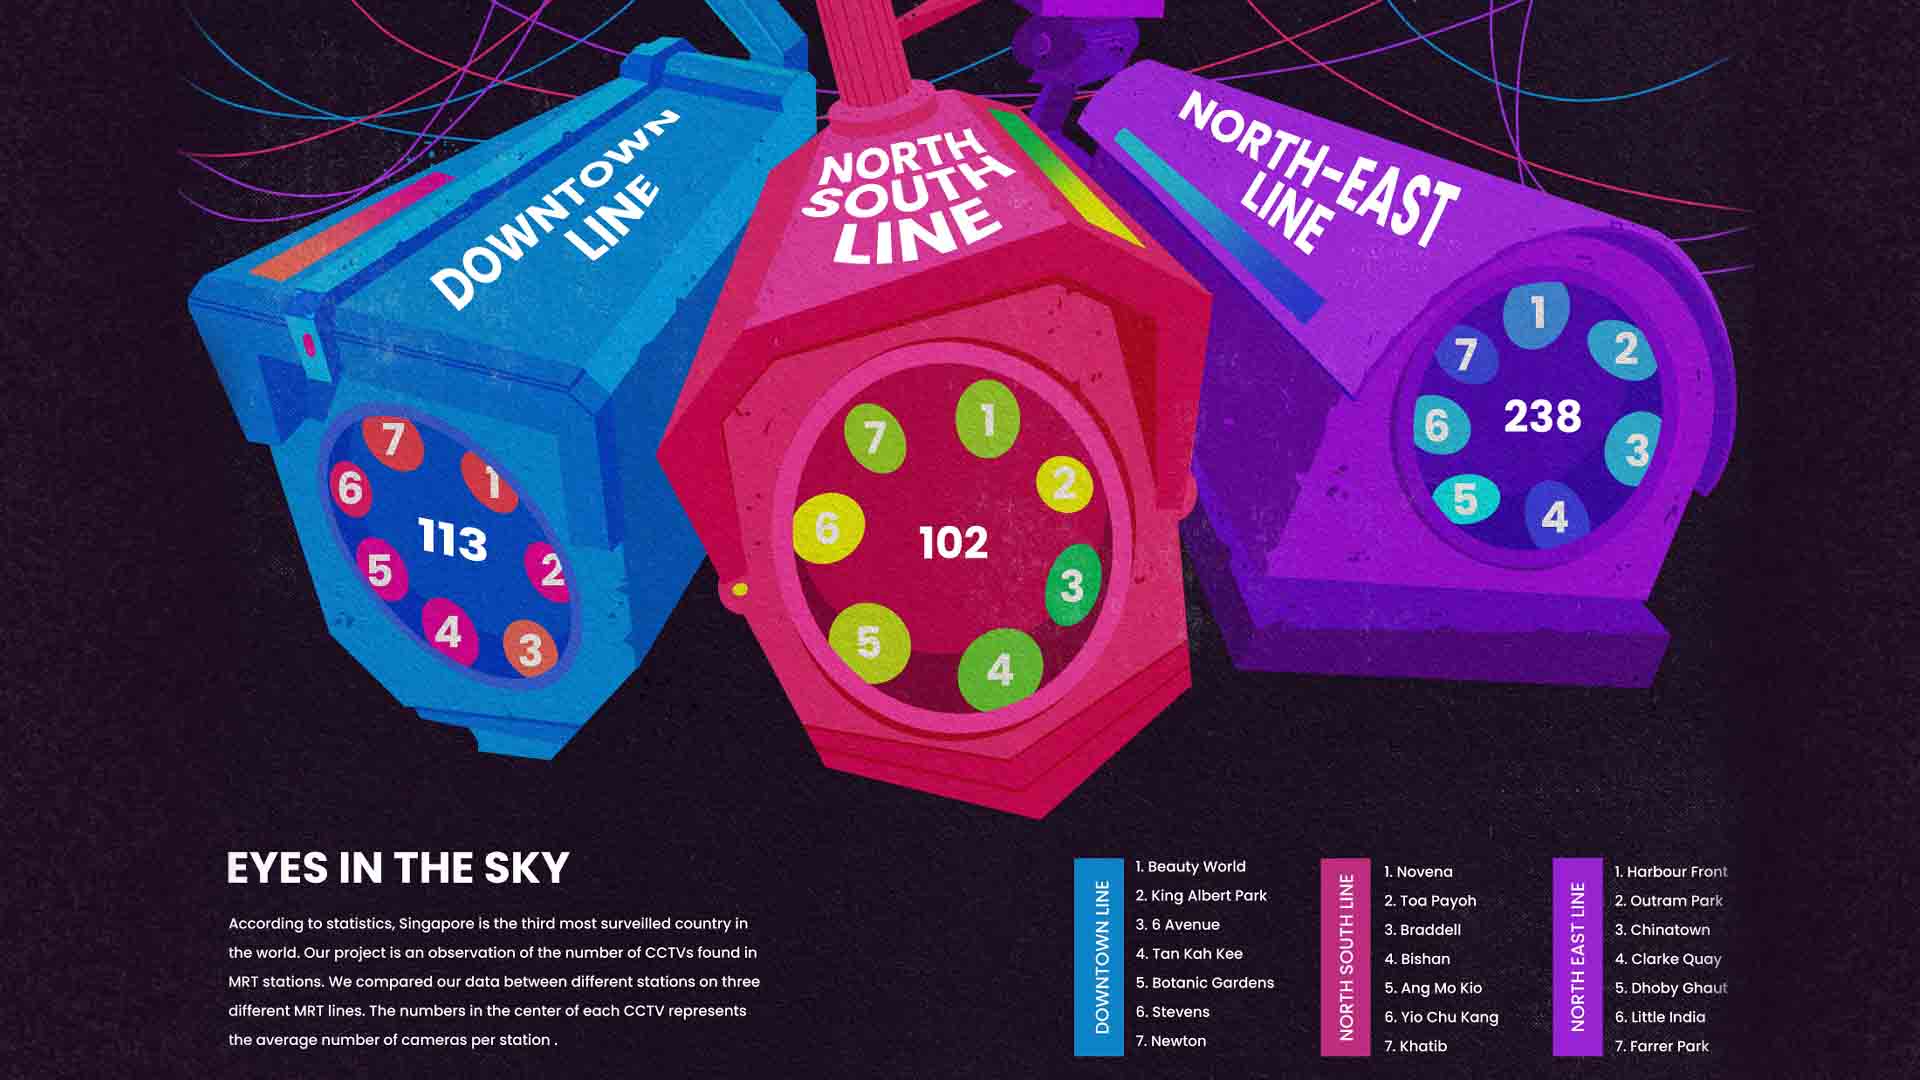
During our Trip we discovered an overwhelming amount of CCTVS in each station with at least over 100 CCTVs at any one station. The average CCTVs we found for each station are as follows. The Downtown line has 113, the North South line has 102 and the North East line has 238. We noticed a pattern with the data. Stations that have a high amount of human traffic tend to have an extreme spike in CCTV numbers. This applies to stations that are an interchange or are in town.
From the graph above we can conclude the following:
1. The amount of CCTVs in MRT stations are determined by the amount of human traffic
2.The average amount of CCTVS in each MRT station ranges from 100 - 300. Which is an insane amount considering that most of us expected to see around 40-50 CCTVs in 1 station.
Below you can find an excerpt from the data we have used. Based on a data set on Carbon Emission in Afghanistan recorded since 1949—1968, we have extracted the following data points that we have worked with:
| Time | Lat | Long | Data |
|---|---|---|---|
| 2021-08-23-02-03 | 1.320536249 | 103.8435339 | 99 |
| 2021-08-23-02-30 | 1.332554944 | 103.8474145 | 93 |
| 2021-08-23-02-44 | 1.340893654 | 103.8471406 | 88 |
| 2021-08-23-02-58 | 1.35104869 | 103.8482166 | 167 |
| 2021-08-23-03-10 | 1.370132686 | 103.8495554 | 94 |
| 2021-08-23-03-35 | 1.381901796 | 103.8447509 | 90 |
| 2021-08-23-03-50 | 1.417627163 | 103.8329838 | 86 |
| 2021-08-20-01-50 | 1.341795569 | 103.7759085 | 90 |
| 2021-08-20-2-15 | 1.335892192 | 103.7832141 | 94 |
| 2021-08-20-2-43 | 1.331827064 | 103.7969684 | 98 |
| 2021-08-20-3-12 | 1.32590634 | 103.8079333 | 80 |
| 2021-08-20-3-24 | 1.322581289 | 103.8148749 | 156 |
| 2021-08-20-3-55 | 1.320146491 | 103.825947 | 148 |
| 2021-08-20-4-25 | 1.31403267 | 103.8380062 | 125 |
| 2021-08-20-01-56 | 1.265431804 | 103.8205139 | 225 |
| 2021-08-20-02-26 | 1.28148093 | 103.8391912 | 238 |
| 2021-08-20-02-48 | 1.284480573 | 103.8435939 | 294 |
| 2021-08-20-03-10 | 1.288702248 | 103.8467667 | 102 |
| 2021-08-20-03-30 | 1.299346568 | 103.8455542 | 369 |
| 2021-08-20-04-10 | 1.306920116 | 103.8494912 | 267 |
| 2021-08-20-04-26 | 1.312286471 | 103.8555064 | 176 |
Artifact 1 : Infographic
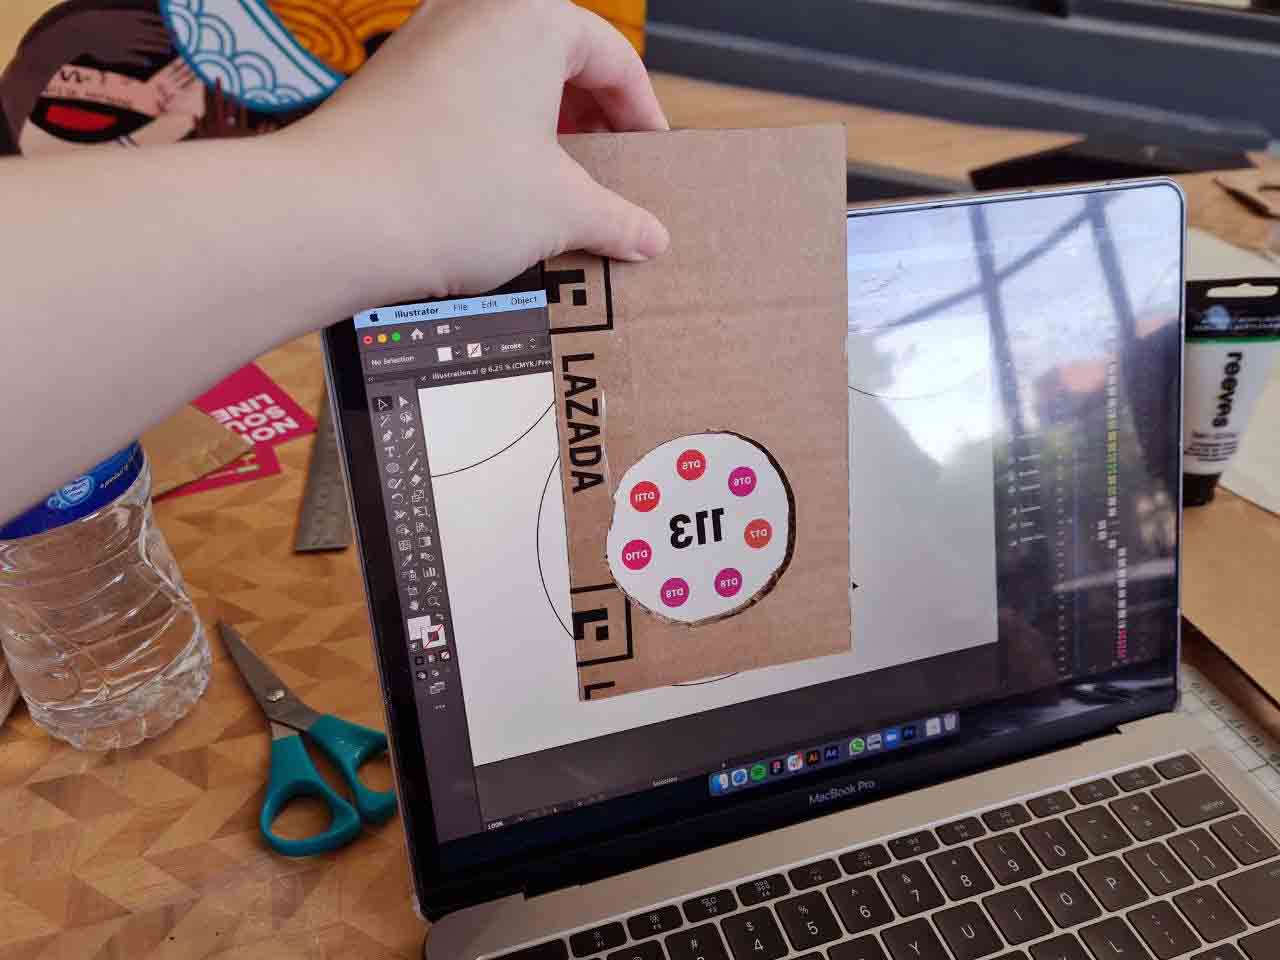
We visualised our findings in the form of an illustrated infographic. We colour coded 3 CCTVs to represent the 3 MRT lines that we had visited. In the lens section of the CCTV, We added a ring of 7 circles. Each one represents a specific station we visited according to the numbers stated in the legend at the bottom right hand corner. We were inspired by the colours of heat signatures and used colour intensity and saturation to signify the amount of CCTVs there are in each station. The more saturated the colour is, the higher the amount of CCTVs present.
Artifact 2 : Projector
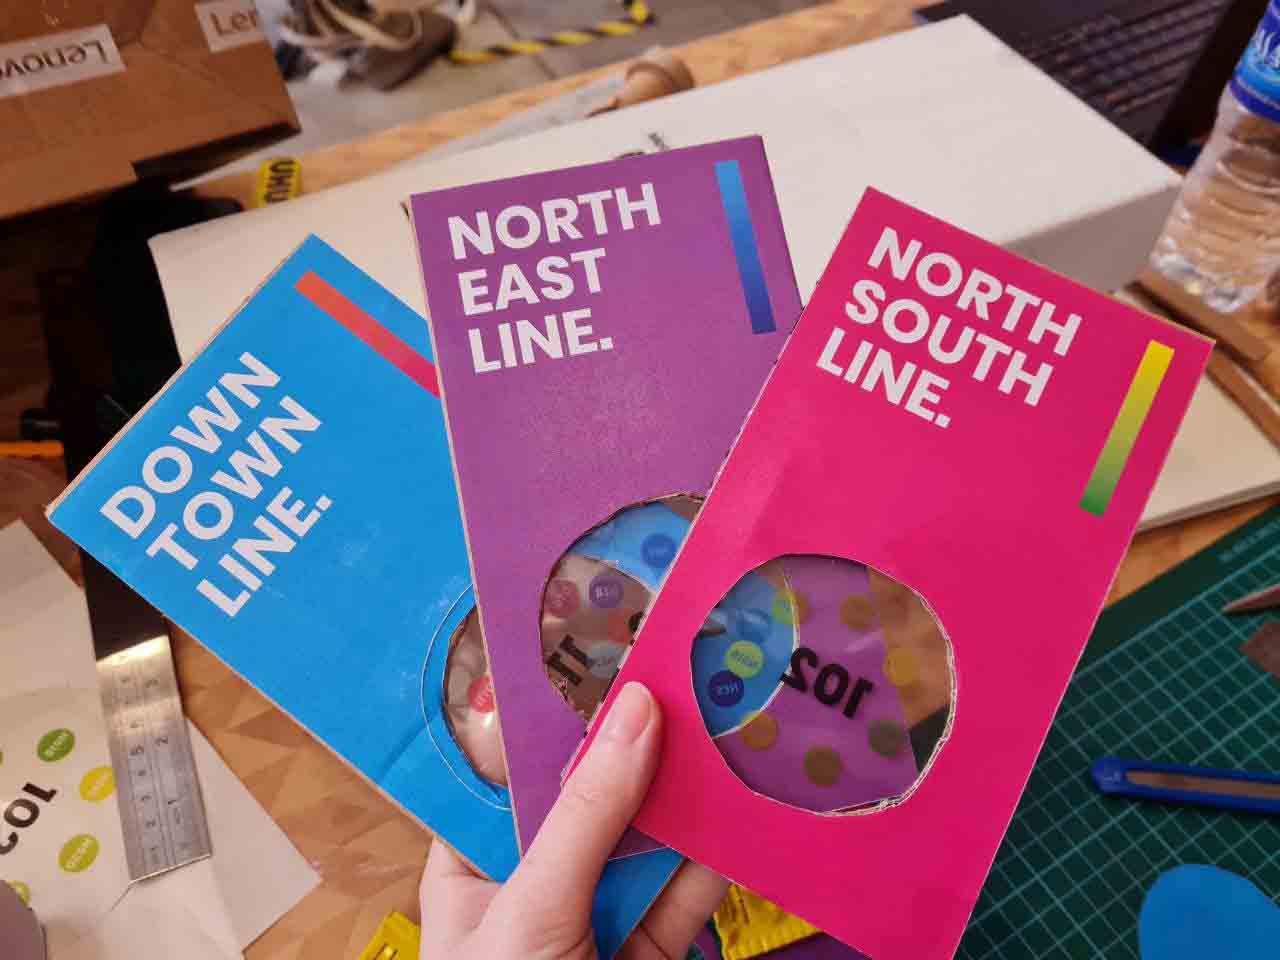
We wanted to make our artifact more interactive so we decided to refine our work and create what we did for the infographic into an actual 3D model. We made a projector box that looked like the shape of a CCTV. To represent the data for each station, We used 3 different projector slides made out of transparency to present our data when light is shined through it. To add interactivity, the light source that will be used in the projector is the user’s phone flashlight. The end result is a working CCTV camera that projects data from surveillance cameras in MRT stations instead of spying on us 24/7.
Process Artifact 1 :
We split up the work into three. Isabelle worked on the base sketch of the CCTVS and the layout of where things were supposed to go, Gracie added the colours and Alvina added texts.
Process Artifact 2 :
To make the box, we used scrap pieces of cardboard, toilet roles and a shoe box. We also added styrofoam inside the box so that it could hold the sliders and the phone when it is inserted into the box via the holes we cut on the top of the box.
For the sliders, we printed out data on transparent paper and sandwiched it between cardboard and paper. To ensure that we are still able to identify each station in the ring of circles, wwe identified them on the transparency by their MRT code number and added a legend at the back of the slider stating which station each code is referring to.
Reflection
This project helped us become more observant of our surroundings and envision our world and what we know of it in data. As designers, we also got the opportunity to play around with these numbers to create and communicate messages behind the numbers. Numbers are not just numbers when design is applied to it. It now has new meanings. Overall, we faced challenges such as codes not working properly, things not going the way we wanted as we created physical mockups and trying to figure out how to solve all these problems. However, as a team we managed to work through these issues together and the artifacts we made came out better than we expected due to the collective team effort.
